Region of the Semipalatinsk nuclear testing area


Sultangazin U.Ì., Zakarin E.À., Spivak L.F., Muratova N.R., Terekhov À.G., Arkhipkin O.P.

MONITORING of TEMPERATURE REGIME in AREA of SEMIPALATINSK TEST NUCLEAR SITE


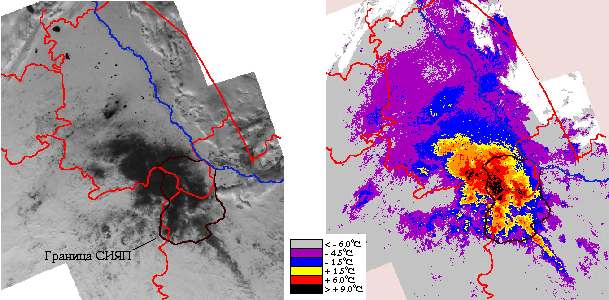
Since 1996 Space Research Institute of the Ministry of science and Higher Education (SRI) conducts regular monitoring and operative mapping of Kazakhstan territory using the remote sensing data from the NOAA satellites. Both snow cover maps for the winter period and vegetation state and surface temperature maps for warm season are formed. In February, 1997 the large snowless zone in the area of Semipalatinsk Test Nuclear Site (STNS) was fixed by images in the visible band (see fig.1). The thermal infrared (IR) (band 4) data has allowed to allocate a few sectors with higher (more than 10oC) temperature in the zone center (see fig.2). In March the configuration of thermal anomalies essentially did not change. Zone of higher temperature disappeared when air temperature had increased and a ground surface had warmed up higher than 25oC. It is necessary to note, that in places of the temperature anomaly the vegetation was almost absent during all verdure season. In the autumn the obviously expressed temperature anomalies were not found.
Fig.1-2. Condition of snow cover and temperature field of STNS region by NOAA/AVHRR data (17 February 1997), channels 2, 4.
170297_p12.jpg (39659 bytes)
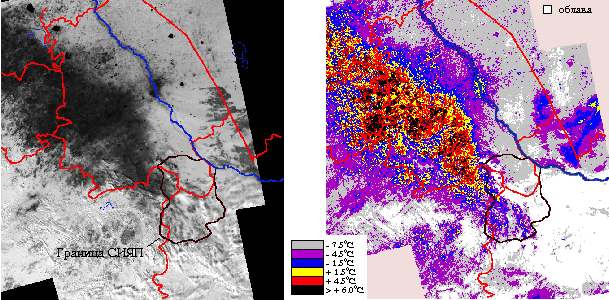
In 1998 the picture of temperature fields in SNTS was strongly deformed by the most powerful center of the future drought generated on common borders of Pavlodar, Akmola and North-Kazakhstan oblasts at the end of February. To middle of March it covered an extensive zone in northeast of Kazakhstan, switching the polygon territory (see fig. 3 and 4).
Fig.3-4. Condition of snow cover and temperature field of STNS region by NOAA/AVHRR data (12 March 1997), channels 2, 4.
120398_p34.jpg (54527 bytes)
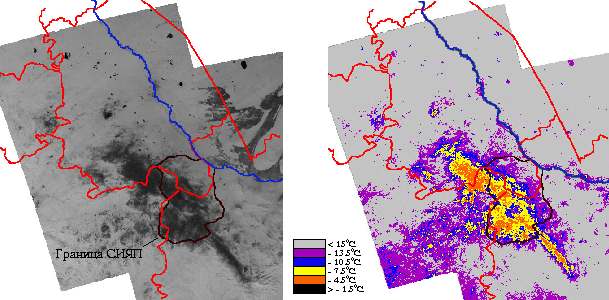
In 1999 the work of temperature mode monitoring in SNTS region was continued. The results of temperature fields mapping have confirmed presence of steady temperature anomalies (see fig. 5 and 6).
Fig.5-6. Condition of snow cover and temperature field of STNS region by NOAA/AVHRR data (7 March 1999), channels 2, 4.
070399_p56.jpg (37295 bytes)
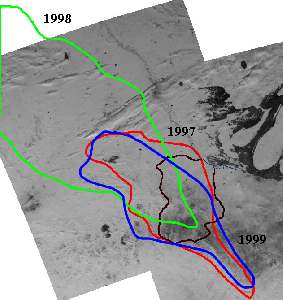
It is necessary also to note amazing similarity of dynamics of development and configuration of snowless zones in 1997 and 1999. The similar contours are looked through on space image for 14.02.1996 (see fig. 7). Similarity is becomed even more evident at spatial overlapping of borders snowless zones constructed on shootings 1997, 1998 and 1999.
Fig. 7. Condition of snow cover of STNS region (14 February 1996) and contours of zones without snow by NOAA/AVHRR data for 1997, 1998, 1999 y.y., channel 2.
140296_p7.jpg (14406 bytes)

On basis of abovestated facts it is possible with confidence to assert that SNTS is in a zone of increased temperature activity. Early appearance of snowless zone and high temperature of ground surface are most likely as consequence of deep thermal processes, probably, initiated by numerous nuclear explosions (Appendix 1). It is necessary to note some deep breaks pass through territory of SNTS. And, as it is known, the underground explosions are capable to change the geological environment.
Unfortunately, we have not the authentic information about temperature mode in this region prior to the beginning nuclear tests. The reasons of seasonal and interseasonal variations in intensity and scales of temperature anomalies remain not clear. Therefore, it is still early to do final conclusions about participation of SNTS in these phenomena. The additional researches are necessary.

Space Research Institute (SRI) searches for the partners wishing to take part in complex monitoring of a temperature mode in SNTS territory and adjoining areas and also the sponsors ready to finance these works (see Appendix 2).
SRI has hardware-software means and organized technologies of monitoring and operative mapping of SNTS territory with use of the NOAA (USA) and RESOURCE-01 (Russia) satellites data. In 1998 SRI together with Association "Isotope", Institute of Geophysical Researches of the National Nuclear Center and International Institute of the Applied System Analysis (IIASA) participated in development of geoinformation system " Semipalatinsk test nuclear Site" (GIS STNS). Besides in SRI there are digital bases of the agrometeorological information and archive data of earth remote sensing on Kazakhstan territory for the period with 1985 for 1998. All this information can be used for retrospective analysis and estimation of the reasons of temperature anomalies occurrence in SNTS area.
Our address:

Space Research Institute of the Ministry of science and higher education of the Republic of Kazakhstan,
Shevchenko st., 15,
480100, Kazakhstan,

Ph. (8-327-2) 49-28-72, 49-43-55 (fax), 61-68-53, 61-80-77 (fax)

E-mail: remote@astel.kz


Appendix 1
The historical information

The Semipalatinsk test nuclear site is located on crossing of three oblasts of Kazakhstan (Pavlodar, Karaganda and East-Kazakhstan) and occupies the area in 18 thousand sq. km. During STNS functioning (1949 - 1989) 466 nuclear tests, including 30 ground (in 5 cases the nuclear devices have not worked), 88 air and 348 underground nuclear explosions (UNE) were madeThe tests were spent with devices of various capacity, on different depths and in various mountain breeds.

In the plan of STNS research the special interest represents revealing and analysis of various specific effects, which can be caused by influence of numerous nuclear explosions on natural environment and also development of the recommendations on rehabilitation and peace use of STNS territory.

Appendix 2

The name of the project: Creation of complex system of temperature mode monitoring in Semipalatinsk test nuclear site area.

The purposes of the project

The purpose of works - Study of character and mechanisms of UNE influence on structure and mode of temperature fields (anomalies).

Territory of works: STNS area and bordering territory of East-Kazakhstan, Karaganda and Pavlodar area.

Scale of researches: from 1: 100 000 to 1: 1 000 000.

Levels of monitoring. It is provided to organize regular three-level supervision, switching:

  • Daily space survey of region by AVHRR NOAA in thermal channels (ch 4 - ch5) in day time (end of February - beginning of May) and night time (end of February - beginning of November);

  • Thermal air photography of STNS territory and vicinities (March - May and September - October);

  • Ground measurements of temperature of ground surface and gallery thermocarottage (March - May and September - October).

By results of supervision the maps of temperature fields of STNS territory and bordering territory will be formed. The maps will allow to analyze spatial features of thermic modes in STNS area and to establish presence (or absence) dependence between items of UNE realization and temperature anomalies.

The independent interest is represented by a task of construction of mathematical model for a quantitative estimation of UNE influence on processes of heat transport (heat exchange) in Earth’s crust.

For reception of an objective picture it is necessary to consider three temporary periods appropriate:

  • Natural thermal mode in STNS area to the beginning polygon functioning;

  • Broken thermal mode during tests;

  • Modern thermal mode (after preservation of STNS).

The complex analysis of these data will allow to receive the information for development of the recommendations for the rehabilitation of STNS territory.